How to Find Stocks That Are Getting Ready to Bounce

What’s the best way to learn how to trade stocks?
It’s actually quite simple:
Pick one specific trading strategy, and focus all of your time and attention on it.
Until you have mastered it.
Too often, new traders jump from one strategy to another.
They never stay in one place long enough to learn from their mistakes.
Or to learn from their winning trades.
The trading strategy that you are about to learn is simple, and yet extremely powerful.
It’s a great strategy for anyone who is just getting started trading.
In this book, I will show you how to find the right stocks to trade, and then what to do once you’ve found them.
A final note before we get started:
When you are first learning how to trade, it is important not to focus on the money.
You should focus on only 3 things:
- Your entry price
- Your profit target
- Your stop loss
If you can focus on just these 3 things, then the money will begin to take care of itself.
I know that this works, because that’s what happened to me.
I first worked on perfecting my technique and discipline.
As these evolved, the money naturally followed.
Now it’s time to turn to the details of this powerful trading strategy.
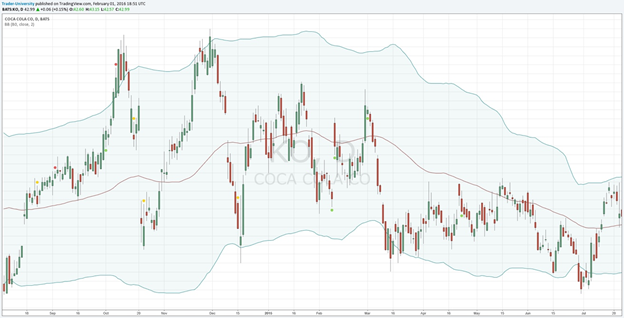
The Rubber Band Stocks strategy uses Bollinger Bands, with a period set to 80 days.
You don’t need to know exactly how Bollinger Bands are calculated for now.
All you need to know is that when a stock closes below the lower Bollinger Band, it should always get your attention.
Each bar or “candlestick” represents one trading day.
If the candlestick is red, it means that the stock’s closing price is lower than its opening price.
If the candlestick is green, it means that the stock’s closing price is higher than its opening price.
The top of the “wick” shows the stock’s daily high price, and the bottom of the “wick” shows the stock’s daily low price.
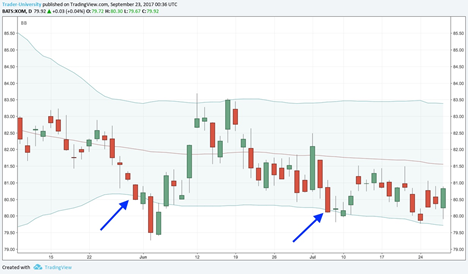
I’ve put 2 big arrows on the chart above to show you the days on which the stock closed below the lower Bollinger Band.
The bottom of the red part of the candlestick is the closing price.
I’ve built a free chart that you can use with any stock here:
https://www.tradingview.com/chart/QxHMkmnE/
To use this chart, just enter a ticker in the upper right-hand box, press enter, and then double-click on the symbol to have it load on the chart.
You may need to sign up for a free account with TradingView.com in order to change the ticker in the chart.
(By the way, my only affiliation with TradingView.com is as a paying customer myself).
Here we are using daily bars, and we have set the Bollinger Bands to use an 80-period (80 days) look-back.
You will notice that the middle band is just an 80-day moving average.
The upper Bollinger Band is always two standard deviations above this moving average.
And the lower Bollinger Band is always two standard deviations below this moving average.
Under a normal distribution, approximately 95% of observations will fall between -/+ two standard deviations.
So if we close above the upper Bollinger Band, or below the lower Bollinger Band, it’s definitely a fairly rare event, and we need to wake up and take notice.
Readers often ask me why I use an 80-day period, rather than another setting.
The short answer is this:
To continue reading this book, click here.